
Creating a Tableau Data Pipeline with TSA Passenger Data
Since 2019, the TSA has published daily counts of people screened at U.S. airport checkpoints. I was curious to see how those counts changed during the COVID-19 pandemic and the recovery that followed, so I used the data to build a small, automated path from the TSA’s HTML table to a refreshed Tableau data source, using free tools along the way.
Calling it a “data pipeline” is probably overstating the work here, but I think it’s good to start with something simple to illustrate what an end-to-end data flow can look like with Tableau. In particular I wanted something that could run automatically (i.e. more than just a one-time analysis) and use free web resources. Here’s the picture of what I assembled:

TSA Source Website
The TSA screens all commercial airline passengers and bags on departing flights in the United States. On their website they publish checkpoint travel numbers which are a simple headcount for each day:
| Date | Numbers |
|---|---|
| 11/1/2026 | 2,530,793 |
| 10/31/2026 | 1,686,878 |
| 10/30/2026 | 2,349,091 |
| etc |
This data set doesn’t break it down further by city or airport, but I thought there might be some interesting ways to look at this.
GitHub CSV Data
The TSA site does not have data download options (like CSV), but instead uses HTML tables. I created a simple GitHub project to regularly download and parse the data: bcantoni/tsa-data.
My favorite trick here is having a GitHub action which runs the collection script, then commits the data back into the repo. This was inspired by Simon Willison’s projects like simonw/sf-tree-history: Tracking the history of trees in San Francisco.
With the TSA data automatically saved, it’s available two ways:
- File viewed in GitHub: https://github.com/bcantoni/tsa-data/blob/main/tsa.csv
- Raw file (useful for my next step): https://raw.githubusercontent.com/bcantoni/tsa-data/refs/heads/main/tsa.csv
(Because this is a public GitHub repo, the raw file is available without any login required.)
The TSA site says the data is updated on weekdays before 6am Pacific, so I’ve set the GitHub action to run at 8am Pacific only on weekdays. TSA data also lags by a couple days.
Tableau REST API Connector
Next up is bringing that CSV file into Tableau using a connector. In the past, this could have used the Web Data Connector, but those had their own issues and are deprecated now. The new and improved solution is the Tableau REST API Connector. This connector fetches data using REST calls in either JSON or CSV formats, bringing the data automatically into Tableau.
The REST API Connector requires installing its JDBC driver and works with Tableau Desktop 2023.3 or newer.
Because no authentication is needed to reach the target file, I just need to point to the raw file and set the expected response format:
- REST API URL: https://raw.githubusercontent.com/bcantoni/tsa-data/refs/heads/main/tsa.csv
- Response Format: CSV
- Tableau Table Name: TSA Data
This connector is extract-only, meaning data must be extracted into Tableau first. After connecting to the REST API data source, I created a simple workbook to confirm the data was correctly embedded in the workbook and coming through as expected:
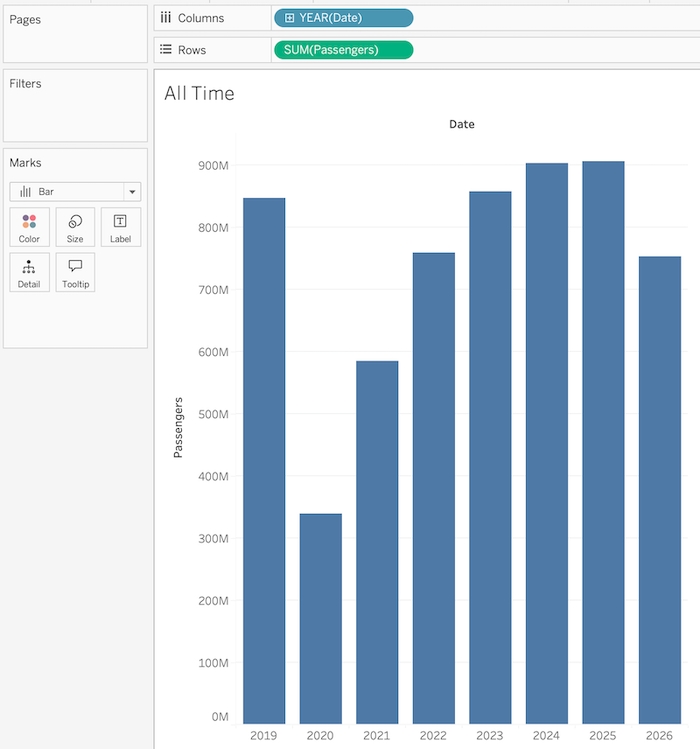
Tableau Published Data Source
Data embedded in Tableau workbooks is a good start, but more possibilities open up when you move it to a published data source (PDS). PDS are the mechanism for sharing a data set across multiple projects or people, and are required for some AI features we’ll explore next.
To match the TSA data and GitHub timing, I set the extract refresh to happen at 10am Pacific time on weekdays.
Tableau Workbook
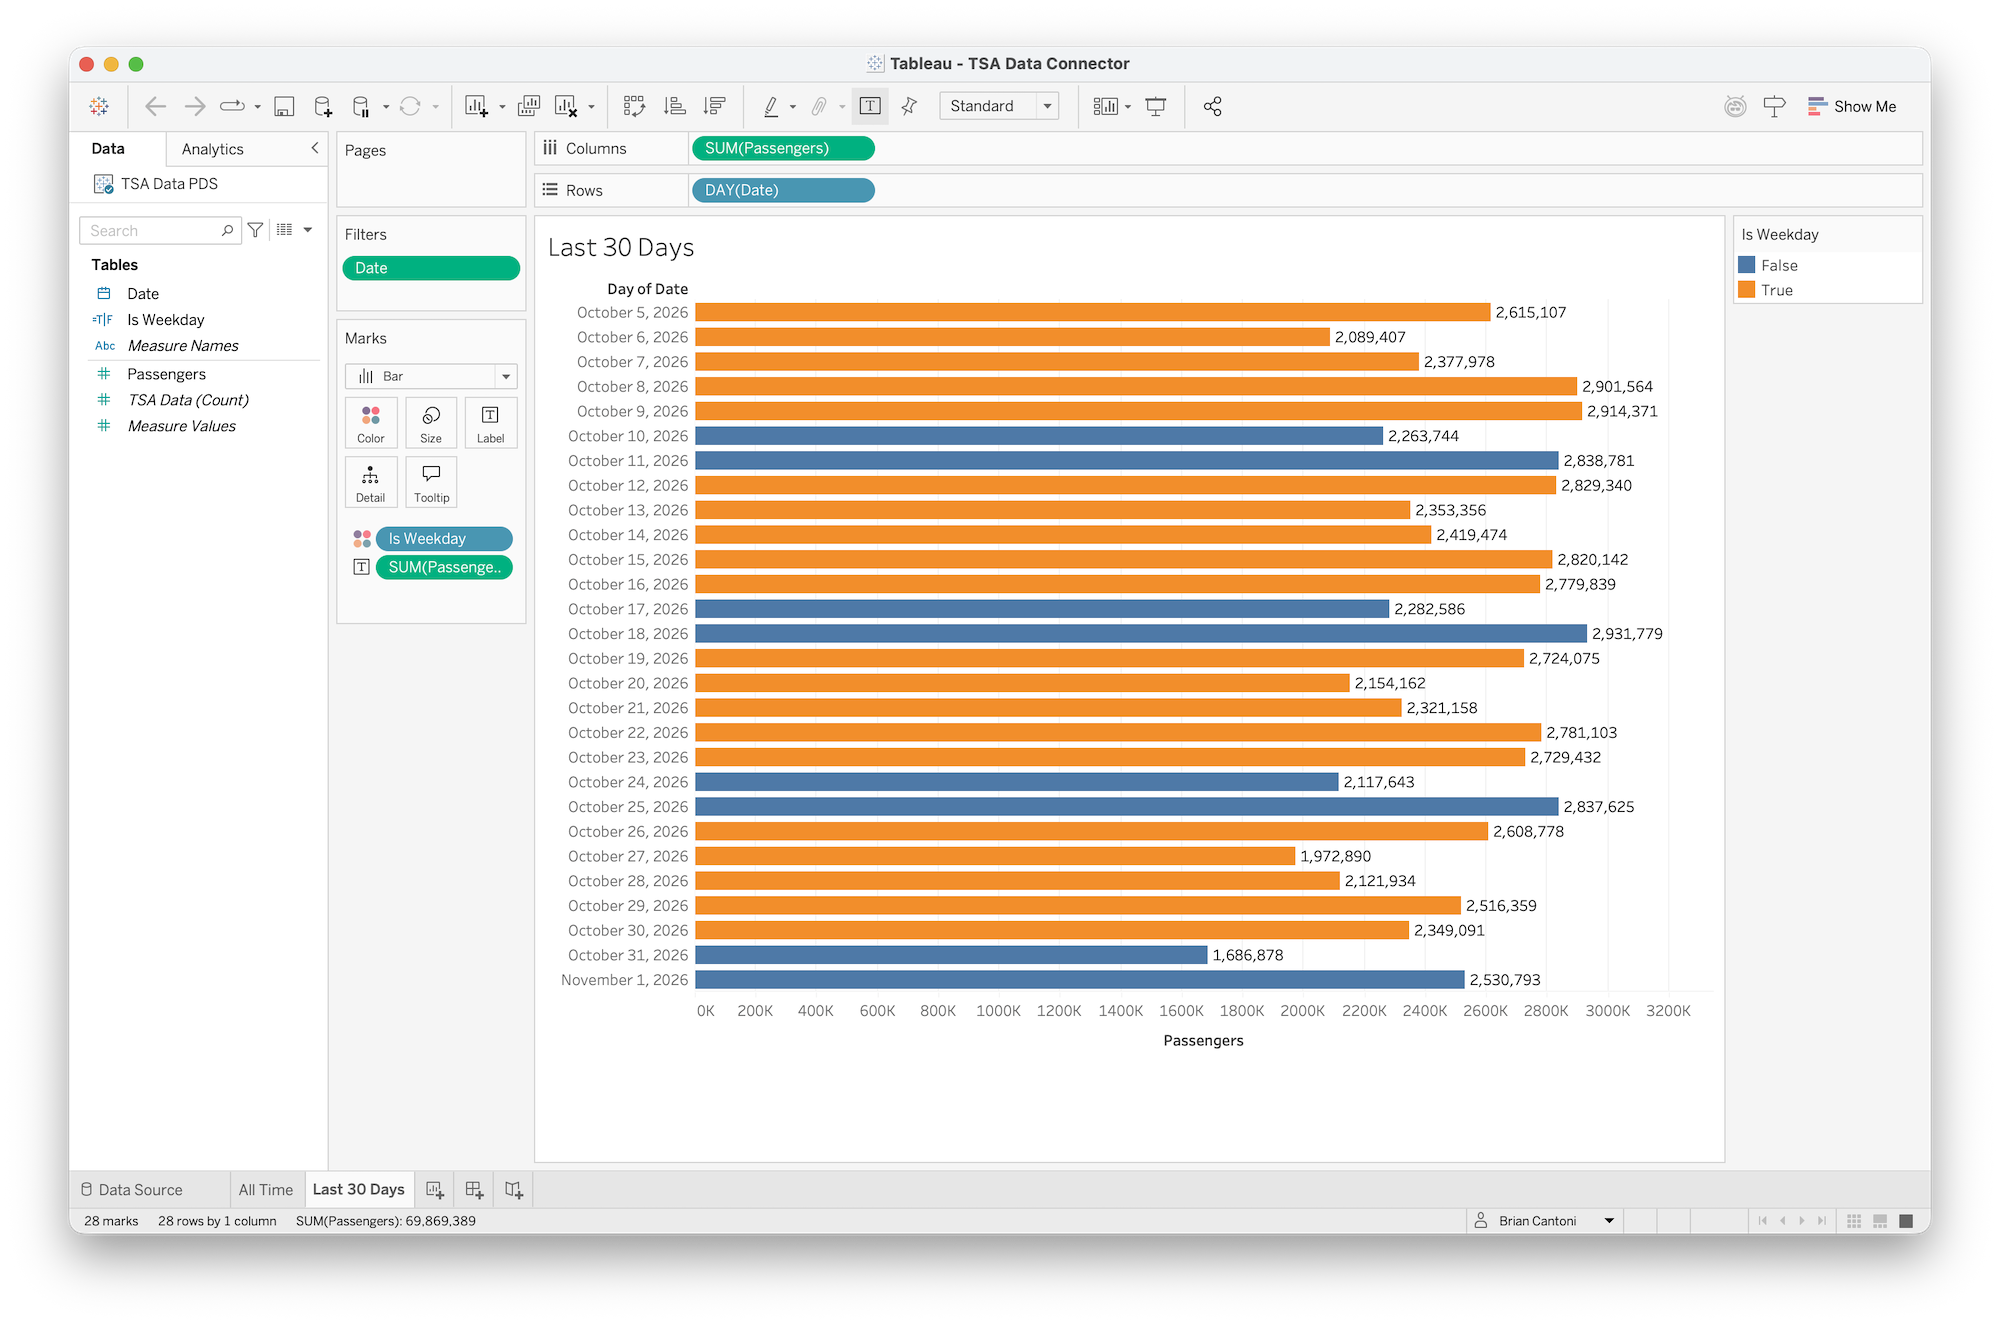
As a final step I created an extremely simple workbook using that published data source. I also confirmed that the scheduled refreshes ran as expected and kept the data current automatically.
Notes and Next
This is all possible with a free version of Tableau: the Developer Sandbox. Join the program and request a free test site here: Tableau Cloud Developer Sandbox
The useful part for me was seeing how a few scheduled steps can turn a public HTML table into a reusable Tableau data source.
Next up: Exploring this data with Tableau’s new AI capabilities including the Tableau MCP connector and the Data Apps “vibe-coding” feature!
- ← Previous
MarkEdit Sort Text Extension