
Exploring TSA Passenger Data with Tableau MCP and Data Apps
I built a pipeline that publishes daily TSA passenger counts to Tableau. In this post, I’ll use Claude to explore the data and create an interactive Tableau Data App.”
In my last post (Creating a Tableau Data Pipeline with TSA Passenger Data), I built an automated pipeline that collects daily TSA passenger counts from the web, saves them as a CSV on GitHub, and brings them into Tableau using the REST API Connector. I published the data source with a scheduled refresh and used it to create a simple workbook, setting the stage for exploring Tableau’s AI capabilities.
Now that we have the data pipeline and the published data source, we can explore that further with new Tableau AI capabilities:
Tableau MCP - Tableau MCP is a project my team created last year and we’ve continued to grow its capabilities. With an MCP-compatible AI agent (like Claude or ChatGPT) you can connect to your Tableau data from either Tableau Server or Tableau Cloud.
Tableau Data Apps - Tableau Data Apps are available now in Beta for Tableau Cloud customers. In short, you can “vibe code” an analytical app built on Tableau data and published on the Tableau platform. The announcement blog post has a great summary: Tableau Data Apps: From Prompt to Trusted Agentic Analytics.
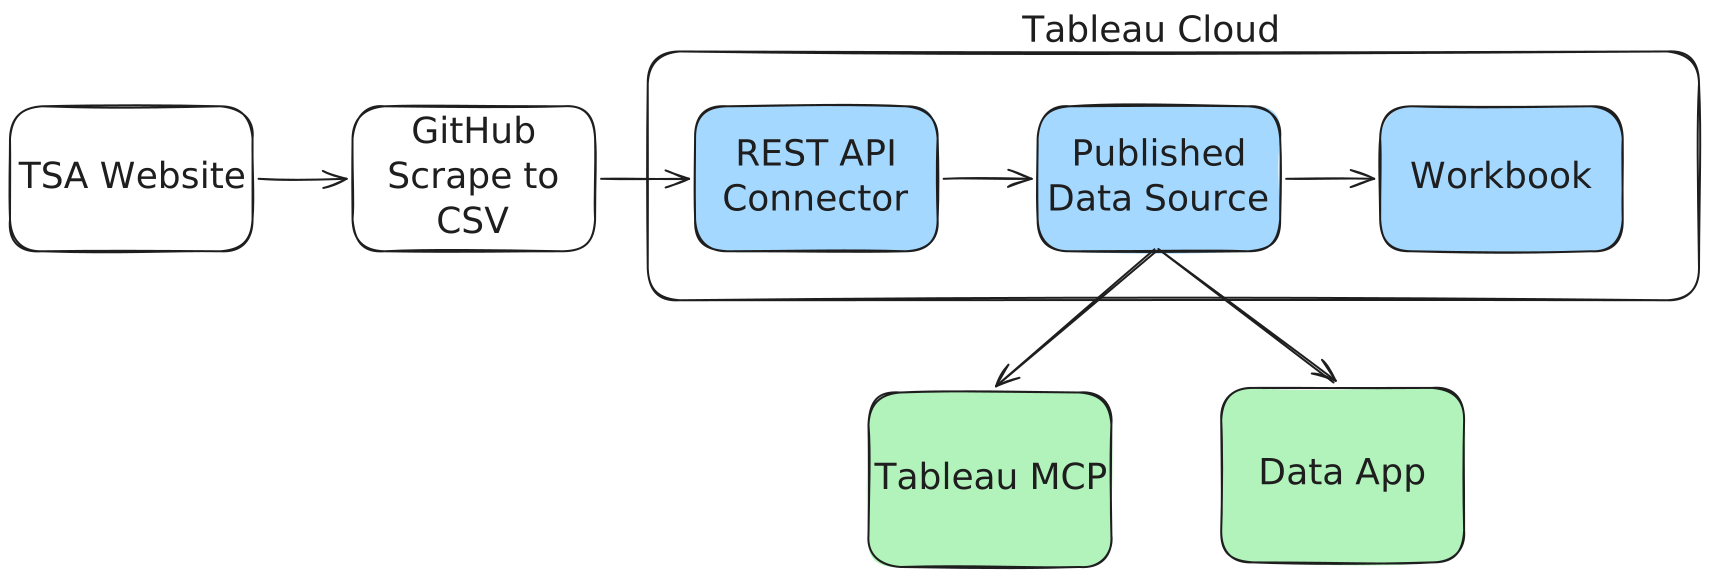
Tableau MCP
For my example here I’m using the Tableau Cloud hosted MCP service (mcp.tableau.com) and Claude Desktop. I’ll start with a simple prompt to find my published data:
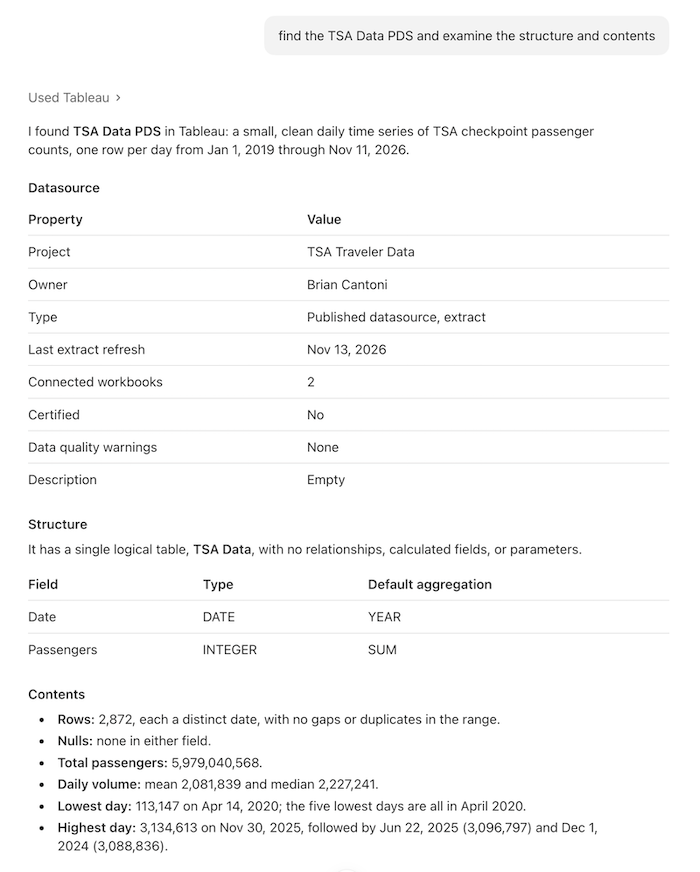
find the TSA Data PDS and examine the structure and contents
Claude uses the tools available in Tableau MCP to find the data set, query the metadata, then query and summarize all the data. For bigger data, the AI agents will usually just explain the metadata. In this case it was ambitious and just fetched everything to summarize the totals.
MCP is a great way to “ask questions of your data”. The AI tools and agents have become quite good even for subjective requests like this where I’m asking for things which are interesting:
what were some interesting outliers for travelers in 2025?
It found a few interesting points, mostly around holidays.
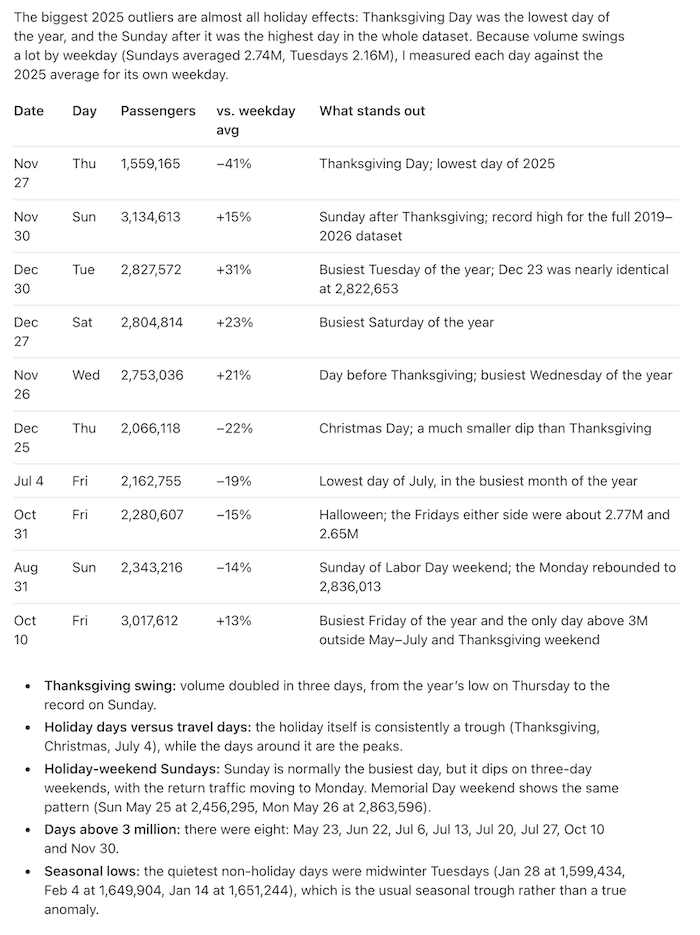
Tableau Data App
Going beyond just asking questions, we can build (vibe code) a full web app using this same published data. This has been possible before - you could always ask Claude to build you a dashboard - but now with Tableau Data Apps we have built-in support for creating and publishing apps within Tableau.
From my viewpoint these are the top advantages to Data Apps:
- Take advantage of live data rather than a one-time snapshot
- Published within the Tableau system, so they can be easily shared
- Respect for all the built-in governance, in particular ensuring that users only have access to data for which they have permission
Data apps are implemented as a combination of some new Tableau APIs, tools exposed through Tableau MCP, and a Tableau Plugin with new skills to tie it all together. You create them through prompts and iteration. I created a simple one using a prompt like this:
create a data app using the published datasource TSA, I'm particularly interested in
showing year over year numbers, and to highlight any interesting outliers. also make
sure the app is responsive and will work okay on mobile
The resulting app was really good for essentially a one shot! I made a few changes (with prompting), but it got really close on the first try.
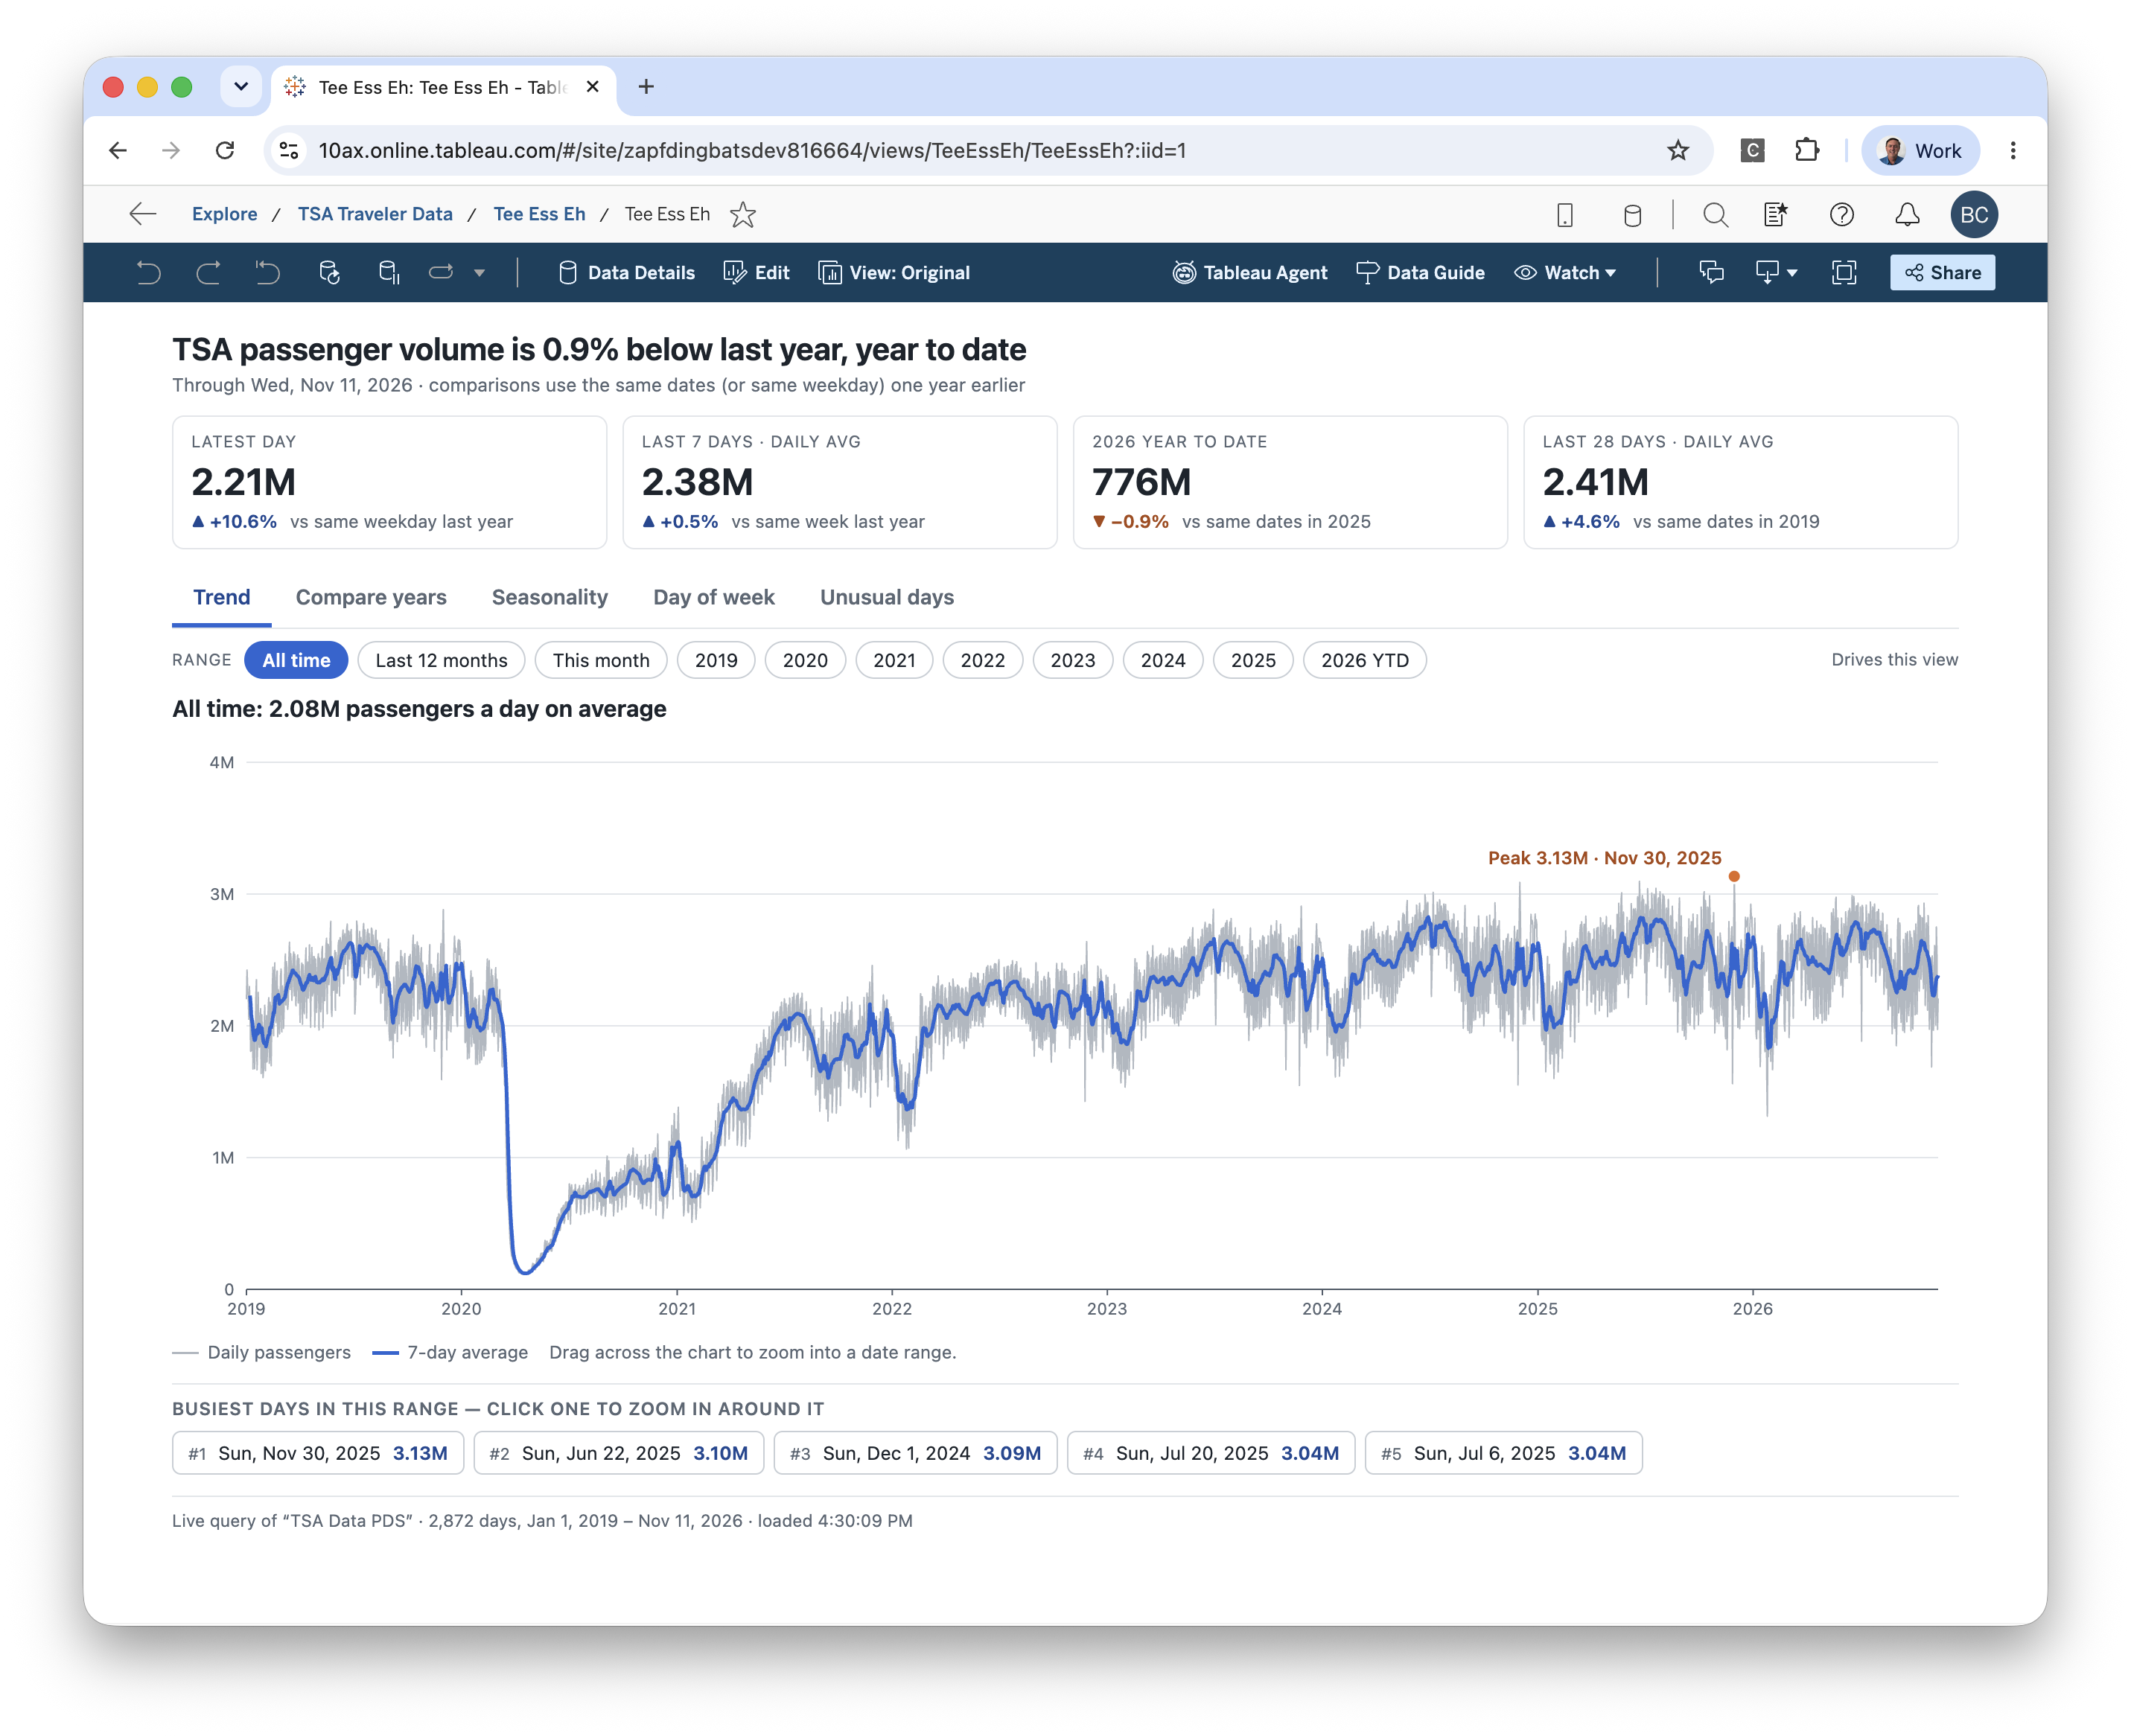
With the data pipeline in place, I could go from asking questions to building an interactive app using the same Tableau data source. The first version got surprisingly close, and a few follow-up prompts helped refine it.
- Exploring TSA Passenger Data with Tableau MCP and Data Apps
- Creating a Tableau Data Pipeline with TSA Passenger Data