
Updating a Tableau Data App from my Phone
I recently built a Tableau Data App to explore TSA passenger data. For my next experiment, I used Claude on my phone to add a dark mode button, publish the change, and view the result in Tableau Mobile.
In my previous post, I used Claude and Tableau MCP to build an interactive app on top of a published Tableau data source. The app shows daily passenger counts, year-over-year comparisons, and other patterns in the data. I had asked for it to work on mobile, so I wanted to see how far I could take the next change without going back to my computer.
Note: This whole post was written by AI agents. Normally I’m the author of everything here, but this was a good experiment.
Adding Dark Mode
I opened the conversation in Claude mobile and asked:
Can we add a dark mode button for this dashboard, in the upper right corner
Claude made the change and showed me a preview. The button switches between light and dark mode, and on a phone-width screen it shrinks down to just the icon.
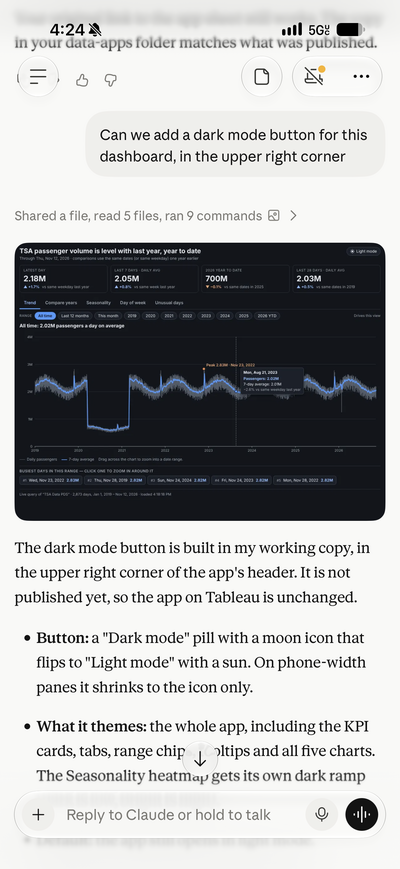
Claude also shared a useful summary of the change and its testing. It tested the app at desktop and phone widths using a mocked Tableau API and synthetic data, so the numbers in the preview aren’t real TSA figures. It also noted that the app would still open in light mode and that the theme choice probably wouldn’t be remembered after a reload.
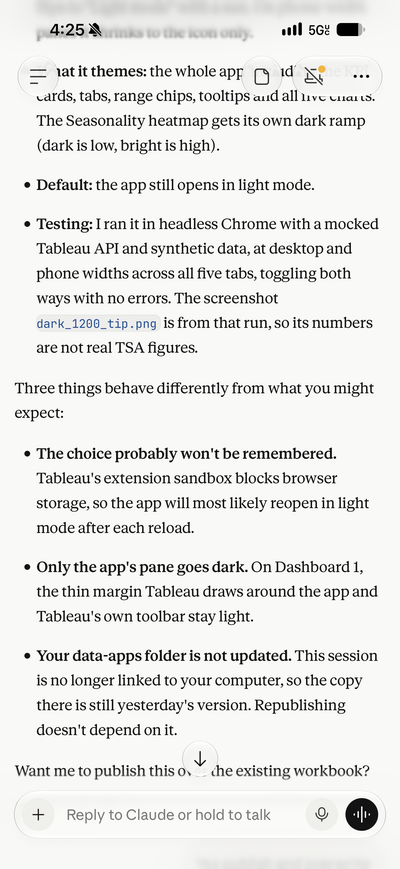
One other detail: this mobile session was no longer linked to my computer, so the local copy of the app wasn’t updated. Claude said it could still publish the change to Tableau, though, so I asked it to overwrite the existing workbook.
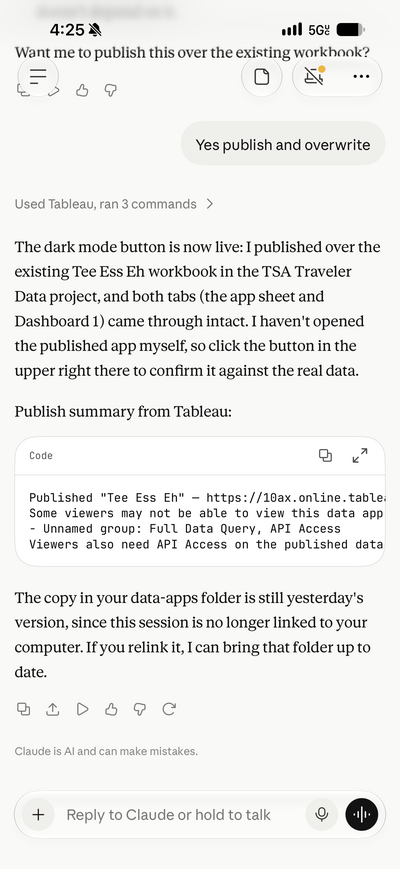
Viewing the App in Tableau Mobile
After publishing, I opened the app in Tableau Mobile and tried the new button. Here’s the app in dark mode:
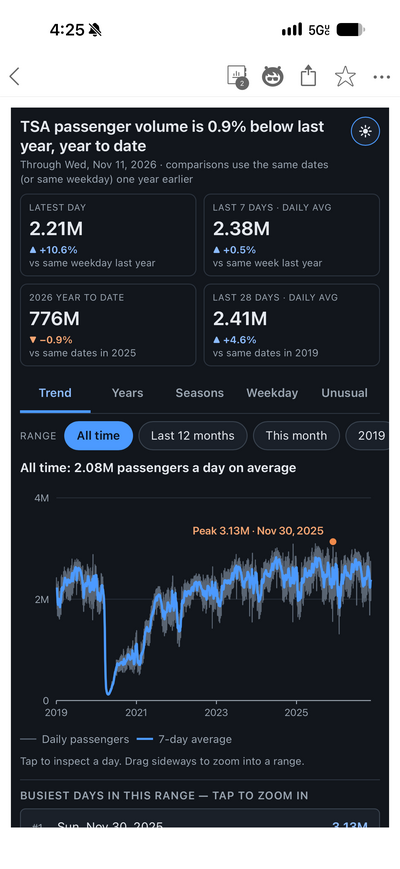
And here’s the same view in light mode:
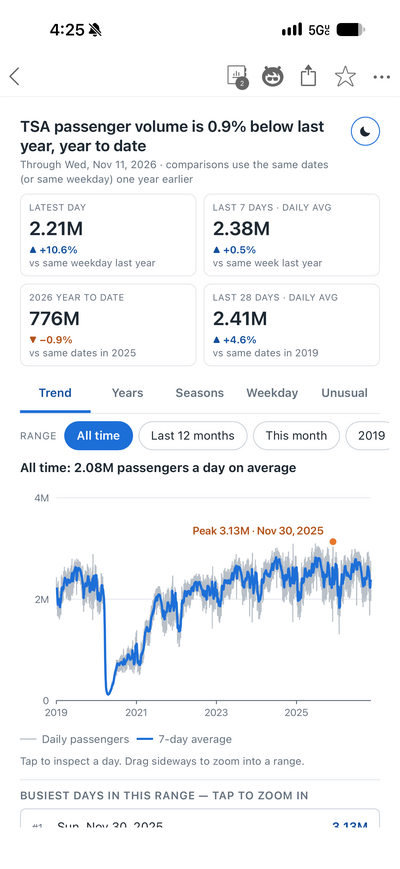
It was fun to make a change, publish it, and try it out, all from my phone. The original app was already responsive, and this was a nice way to see the full loop in action.
- Updating a Tableau Data App from my Phone
- Exploring TSA Passenger Data with Tableau MCP and Data Apps
- Creating a Tableau Data Pipeline with TSA Passenger Data